.png)

We surveyed 159 B2B companies* across SaaS, Hardware, Services, and Marketplaces; from Pre-Seed all the way to Series B+. We wanted to understand where growth actually breaks down, what separates the teams that scale from the ones that stall, and which fixes deliver real impact.
What surprised us: The companies struggling most weren't lacking ideas, effort, or even budget. They were missing something more fundamental: readiness. Specifically, readiness across five interconnected layers. And in almost every case, the symptom they were chasing (usually "we need more leads") was downstream of one or more of these gaps.
Here's what the data shows about each layer, the patterns we see across stages, and the frameworks that actually close the gaps.
Lead generation is the #1 challenge
When asked what their biggest challenge is, most B2B founder will say: we need more leads.
Our benchmark of 159 companies confirms it: 67% of teams name lead generation and customer acquisition as their single biggest challenge.
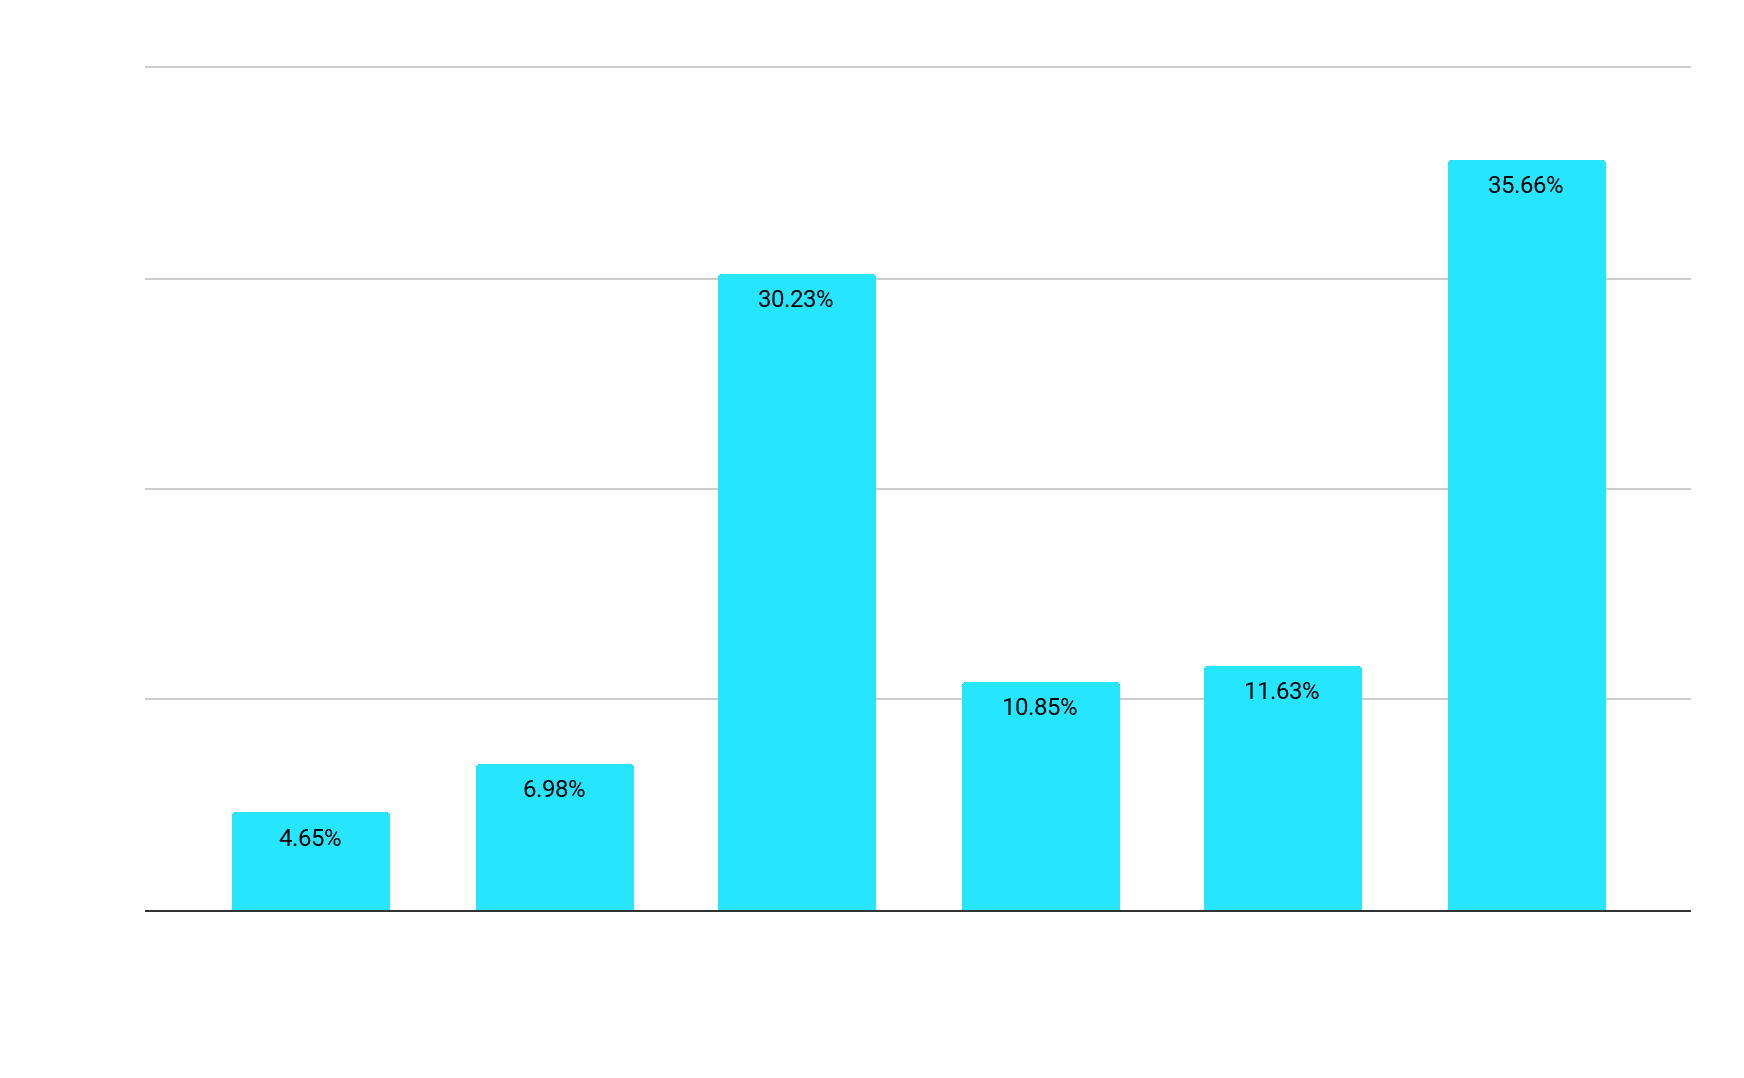
But here's the uncomfortable part: in almost every case where lead gen is broken, lead gen isn't actually the problem. It's a symptom of unresolved gaps further upstream. It lays in how the company defines its customer, validates its product, structures its sales motion, operates its CRM, and aligns its teams.
We call these the 5 Readiness Layers. When even one is misaligned, every channel you turn on amplifies the problem instead of solving it.
Let's walk through what the data shows about each one and what actually closes the gap.
Readiness #1 - Marketing: Most teams are guessing who they sell to
The single most striking finding in the entire benchmark:
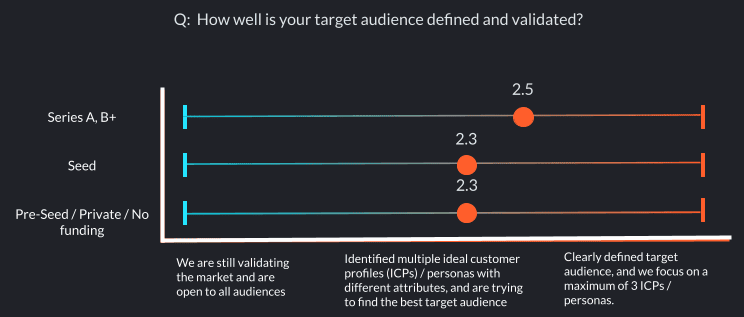
- Only 42% of teams say they confidently know who their target audience is.
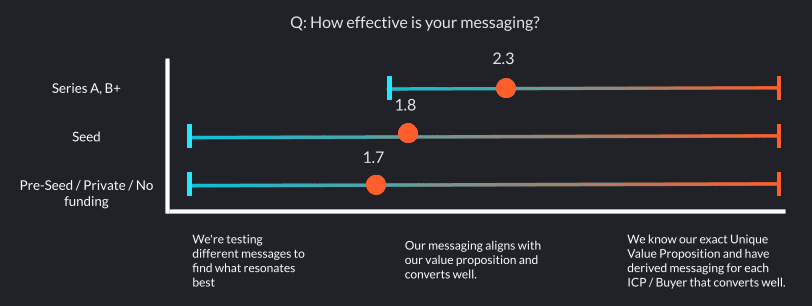
- Only 15% have a precise understanding of their Unique Value Proposition.
- 45% are still trying to figure out which acquisition channels work.
This matters because everything downstream depends on it. If your ICP is fuzzy, your messaging is generic. If your messaging is generic, your campaigns underperform. If your campaigns underperform, you hire more SDRs to compensate, burn cash, and conclude that "outbound doesn't work in our market."
It does work. You're just running it on a broken foundation.
💡 What actually fixes it
🎯 Pick one beachhead: Teams trying to serve 5+ ICPs at once weaken every resource they have. Focus all marketing, sales, and product energy on the single segment where you can win first, then expand in waves.

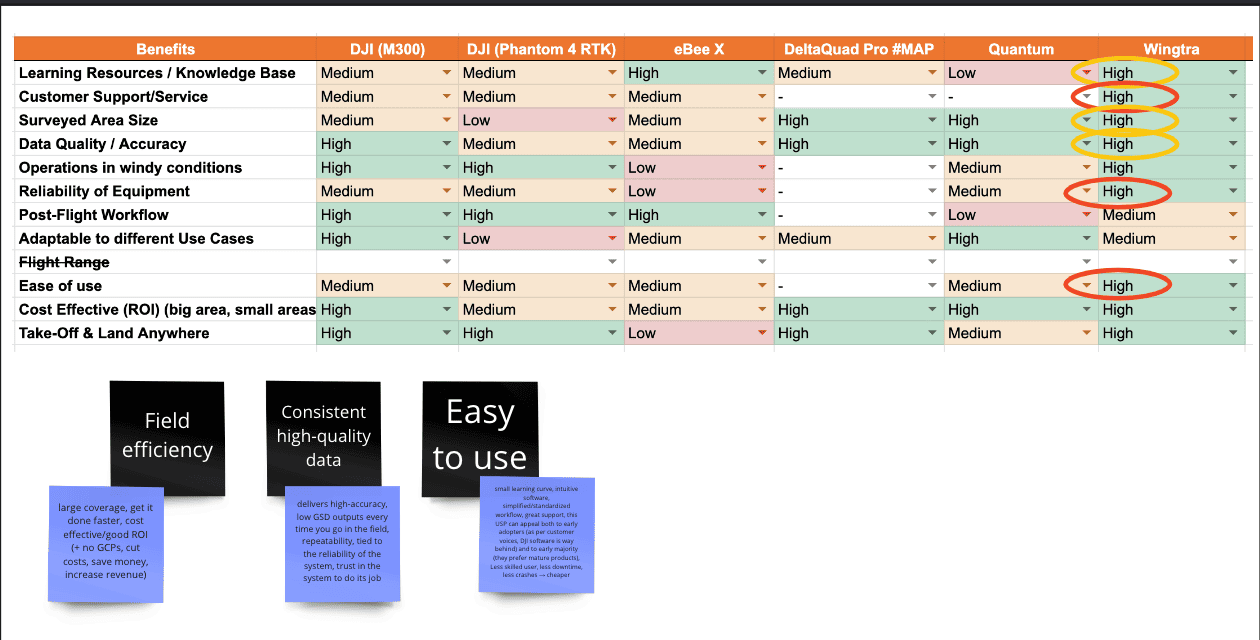
🛠️ Build a Value Prop Grid: Score your benefits against each competitor. Your true USP lives in the squares where you score "high" and they score "low".
Readiness #2 - Product: Only 8% actually measure PMF
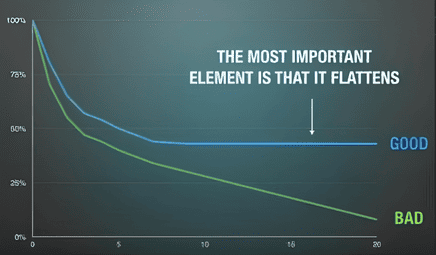
If your retention curve doesn't flatten, you don't have product-market fit (PMF). You have a leaky bucket. (See the retention pattern visualized in the "What actually fixes it" section.)
And yet:
- Only 8% of companies regularly measure PMF using a structured framework.
- Even in well-developed sales organizations, 57% still aren't measuring PMF.
- Companies that apply a PMF framework are far more likely to maintain annual churn below 10% than those that only collect customer feedback (63% vs. 49%).
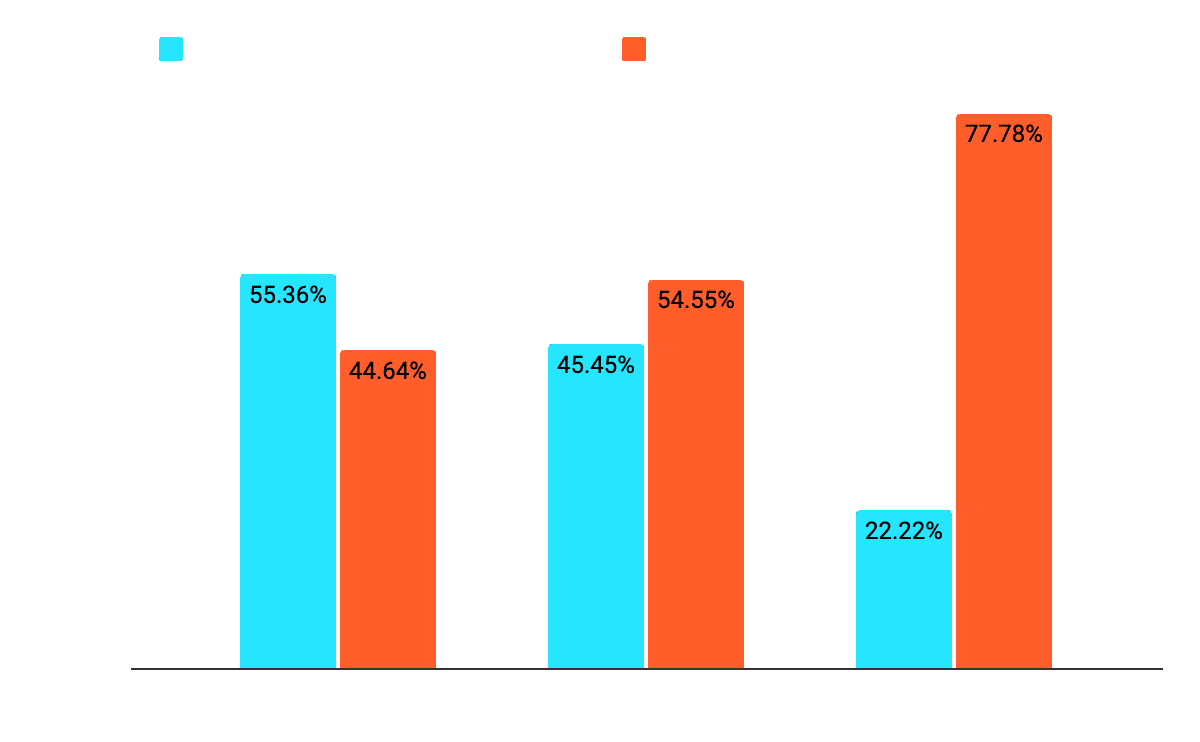
- At Pre-Seed and Seed stage, more than half of companies lose over 10% of their customer accounts every year. At Series A+, that number drops to just 22%, proof that that the earlier you fix retention, the easier growth gets later.
💡 What actually fixes it
📑 Run the Sean Ellis PMF Survey:
- Reach out to your users asking 4 simple questions
- Scores > 40% indicate that you have product-market fit
- You win invaluable insights for your product roadmap and your targeting
📈 Do cohort retention analysis: Don't track average retention, track it by cohort and look for the curve to flatten. Segment your best-retaining users and reverse-engineer who they are. That's your real ICP.
→ The shape that matters most. A flattening retention curve (top line) is the clearest visual signal of PMF. This is far more important than the absolute retention percentage. The goal isn't to keep 100% of users; it's for the line to stop dropping.
Readiness #3 - Sales & Customer Success: Your sales motion probably doesn't match your deal size
There's a quiet mathematical truth most sales teams ignore: your Customer Acquisition Cost (CAC) must be dramatically lower than your Lifetime Value (rule of thumb: LTV:CAC > 3). And the sales motion you can afford is dictated by your Annual Contract Value.
The benchmark shows:
- Only 17% have the right sales process according to deal sizes.
- 87% do not generate after sale revenue.

We commonly see two key mistakes:
- Selling sub-$10k contracts with a high-touch sales team → your CAC eats every deal.
- Selling $100k+ deals with a medium-touch motion → you lose to competitors running real enterprise sales and ABM.
And on the back end, treating Customer Success (CS) as a cost center is the most expensive mistake of all. Companies with a dedicated CS/AM team and a clear success playbook achieve the strongest retention outcomes, with 75% keeping annual churn below 10%.
.png)
💡 What actually fixes it
Match your sales motion to your deal size. The ACV × Touch-Model matrix above shows which combinations work and which don't. Here's how we would describe each one in practice:
🔵 Low-Touch (Self-Serve / PLG) — ACV under $10k Free trials, in-product onboarding, self-service checkout, automated email nurture. Sales involvement is minimal and reserved for upgrades and expansion. Channels: SEO, content, paid search, product virality. → Profitable when CAC stays under ~$1k and you can drive volume.
🟡 Medium-Touch (Inside Sales / SDR + AE) — ACV $10k–$100k Inbound + outbound lead gen, demo-to-close cycles of 2–6 weeks, light proof-of-concept, contract negotiation by phone/video. Channels: outbound (LinkedIn + email), webinars, paid demand gen, partner referrals. → This is the SaaS sweet spot. Profitable when LTV:CAC stays above 3.
🟢 High-Touch (Enterprise / ABM) — ACV $100k+ Named-account targeting, multi-stakeholder buying committees, custom POCs, security reviews, 3–9 month sales cycles, full Account-Based Marketing. Channels: ABM campaigns, events, executive networking, strategic partnerships. → Profitable when deal sizes justify 6+ months of dedicated sales effort per account.
Once your ICP, ACV, GTM motion, channels, and sales process are aligned along the same row of that matrix, growth stops being expensive.
Readiness #4 - Operational: You can't fix what you can't see
64% of B2B companies still can't track their funnel end-to-end. That means two-thirds of teams are still making channel decisions blind.
When it comes to CRM usage, we found:
- 68% of B2B companies use HubSpot, but only 24% use their CRM to its full potential.
- The rest have broken lifecycle stages, inconsistent lead statuses, and reporting they don't trust.

The result: marketing claims credit for revenue where sales feels they closed it, sales blames lead quality, and the founders can't tell which channel is actually profitable.
💡 What actually fixes it
🏴☠️ Implement the Pirate Funnel cohort model: Track Acquisition → Activation → Revenue → Retention → Referral by channel. Suddenly your highest-volume channel, your lowest-cost channel, your best-converting channel, and your biggest conversion leaks are all visible on one screen.

🏠 Adopt industry-standard CRM house rules: Standardize lifecycle stages, lead statuses, and trigger definitions across marketing and sales. Without this, no automation works and no report tells the truth.
Readiness #5 - Strategic: Only 25% have OKRs that actually run the business
Strategy is the easy part. Operationalizing it is where most teams fail.
Only 25% of companies have defined KPIs and OKRs that teams review regularly. The rest fall into one of two traps: either everyone "knows the strategy" but no one is held accountable to specific outcomes, or each team has objectives that don't actually ladder up to the company's revenue goal.
💡 What actually fixes it
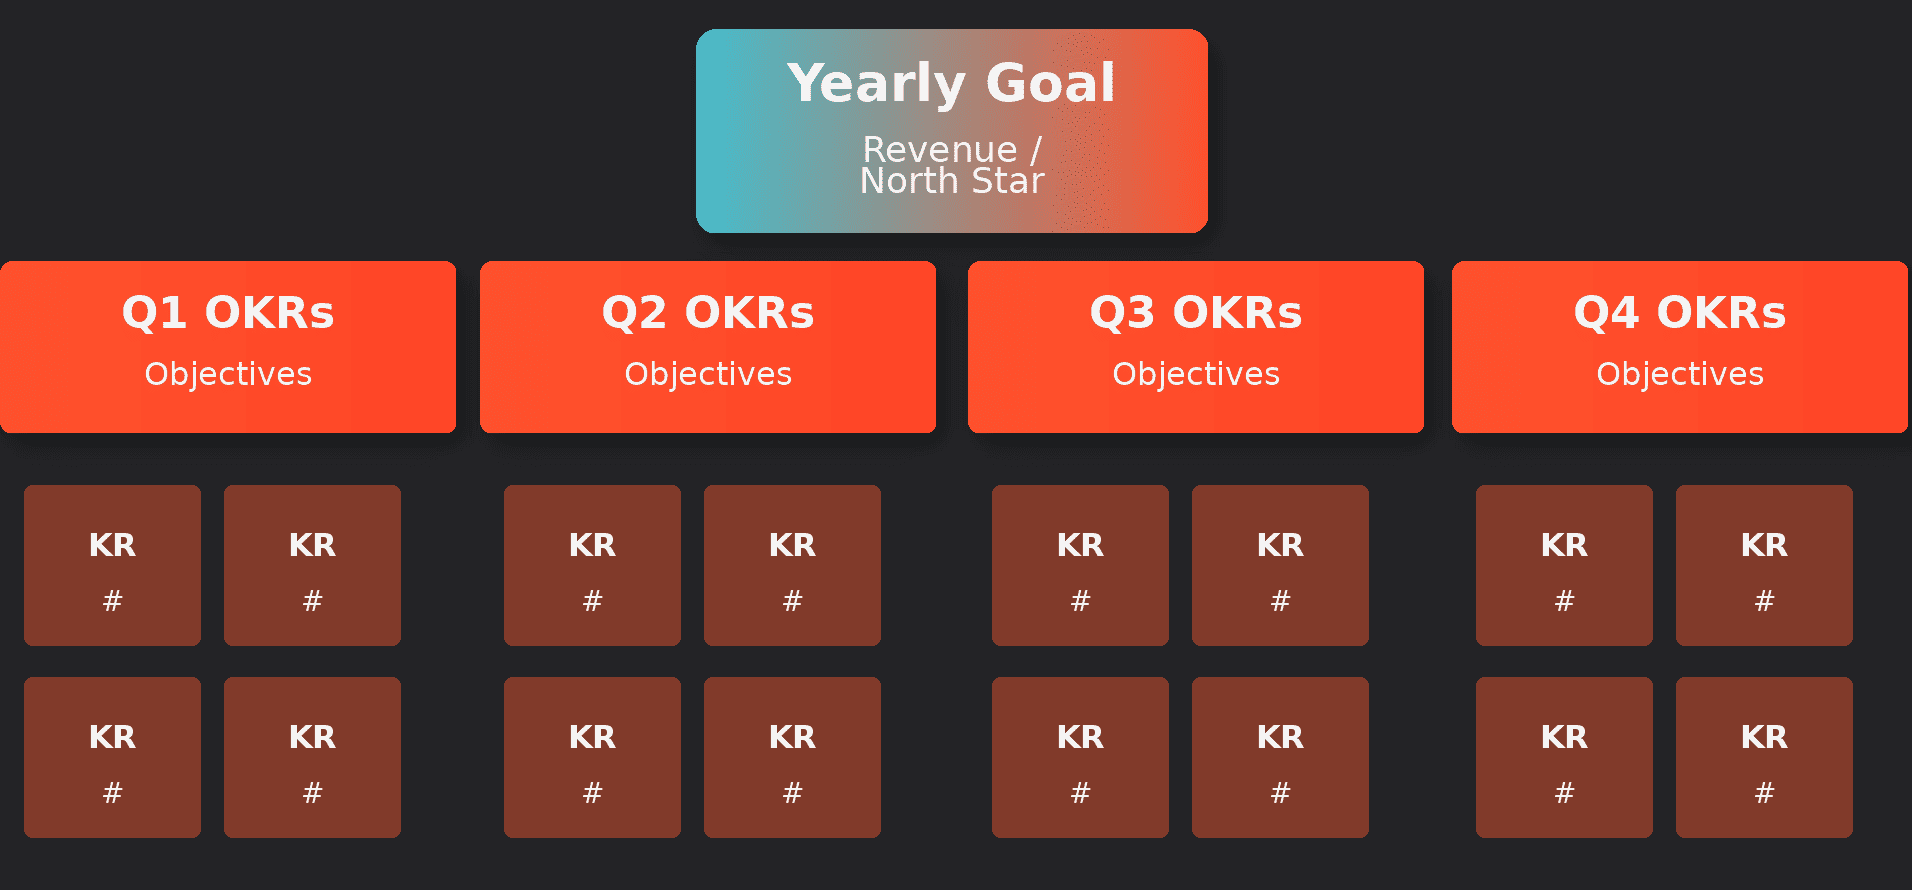
- Set one company-level North Star (annual): Pick a single revenue or growth metric the whole company rallies behind → e.g., "Reach €3M ARR by year-end" or "Grow NRR from 95% to 115%." Everything cascades down from this.
- Quarterly team OKRs: Each team (Marketing, Sales, Product, CS) defines 1–2 Objectives per quarter, each with 2–4 measurable Key Results. Bad KR: "Improve outbound." Good KR: "Increase SQL volume from 40 to 80 per month."
- Run a weekly 15-min OKR check-in: Every team. Status per KR: on-track / at-risk / off-track. No discussion of what, just how confident are we we'll hit it. This catches drift before it becomes a quarter-end miss.
- Quarterly OKR review + reset: Score each KR (0.0–1.0). Anything under 0.4 → root-cause analysis. Anything over 0.8 → was it too easy? Reset for the next quarter.
- Use a tool! Free option: Perdoo (the free tier is enough for most early-stage teams). Other options: Lattice, Workboard, or a structured Notion template.
- The point isn't the tool, it's that OKRs need to live somewhere everyone checks weekly, not in a deck that gets opened once a quarter.he pattern
Every "we need more leads" conversation we have with a founder ends in the same place: the lead gen problem is real, but it's downstream of one or more of these five gaps.
🌟 Marketing readiness: Do we know who we sell to and why they buy?
🌟 Product readiness: Are we keeping the customers we win?
🌟 Sales & CS readiness: Is our motion financially sustainable?
🌟 Operational readiness: Can we see what's working?
🌟 Strategic readiness: Is the whole team pulling the same direction?
Fix these and lead gen stops being the bottleneck. Skip them and no amount of outbound, paid, or content fixes the underlying math.

*this report is based on a survey we conducted in 2024
Ready to get started?
In this session, we will:
- Identify your known and unknown challenges that hinder you from growing your business.
- Get solutions to your problems from GTM experts who’ve scaled high-growth B2B companies.
- Develop a 3-Step action plan that will get you results over the next 90 days.